TIL - Google Sheet Formula Madness
Reading time: 3 minutes (573 words)Author: @pugmiester
Tags: til , stats
Like many folks with a solar and battery storage system, I have a spreadsheet (or rather, multiple spreadsheets) tracking generation, self consumption, import, export, and just about every other stat I can think of that might come in handy later either for drawing pretty graphs or figuring out if we are anywhere near where our suppliers estimate for system performance suggests we should be.
As an Octopus Energy customer, I also have access to all of our electricity and gas meter data in 30 minute segments directly from their API. I have of course I’ve been downloading this data and adding it to one of many tabs across my many Google sheets as well. I’ve then been adding totals for each day for various things and I’m a little ashamed to say that most of this has been manual work.
I knew there had to be a better way but I just couldn’t be bothered figuring it out. I could have just asked Mrs P, because she’s an absolute spreadsheet wizard, but where’s the fun in that. So, here I am, many months along, manually adding subtotals each 48 lines of export data and then referencing those in summary sheets. I know, it’s clumsy, but it’s been working happily and I’ve just stuck with it, until today. Today I decided it was time to find the better way.
Now I’m in no way a spreadsheet expert and no doubt there are a dozen better ways of doing this, but I found a way that works and that I also understand so I was able to adapt it to a few different sheets to automate the process a little better.
So, here’s the problem I was trying to solve. The data (shown below) from the Octopus API provides three colums. The first column contains the values I need to sum per day (either import, export, gas use, whatever) and then ithe second and third colums contain the start and end for the timeslot. The pain here is it includes the date, time, and time zone in one big long list. The date is reversed which makes perfect sense for machine readable data but isn’t how my graphs and charts are setup.
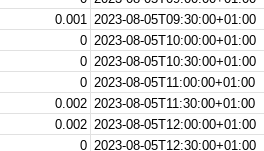
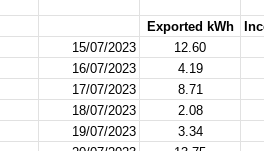
What I figured I needed was a way to total up everything in ithe value column, where the date matched the first 10 characters of the second column. But, my dates on my other sheets are in a more regular format of “dd/mm/yyyy” so I needed a way to get this swapped around to be able to search for it.
After a lot of trial and error and a whole heap of searches and dead ends, I got myself to a solution that works. It takes the date in my human readable list, converts it using concatenate and left/mid magic and uses that as the seed for a regex search through the entire column of data.
=sum(filter('Elec Import 30 mins 2023'!E:E, regexmatch('Elec Import 30 mins 2023'!B:B, (concatenate(mid(L4,7,4),"-",mid(L4,4,2),"-",left(L4,2))))))
As I mentioned, I’m no spreadsheet expert and I’m certain there are simpler or more ellegant solutions, but it works. Now all I have to do is just copy in the next batch of data from the API export and copy down my formula and away we go. No more manually adding subtotals of referencing those subtotals elsewhere, the summary page now just has the forlula it needs to go a do the maths itself automatically.